Earth Science worksheet
    Topic: Front
    Front
    1

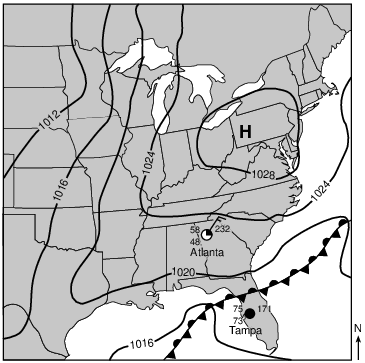
    The map below shows a cold, arctic air mass that moved southeast from Canada to cover most of the eastern half of the United States during January 2010.

    meteorology, transfer-of-heat-energy, meteorology, air-mass, meteorology, front, meteorology, jet-streams, standard-6-interconnectedness, models fig: esci-v202-exam_g10.png

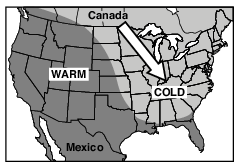
    Which shift caused this flow of cold air out of Canada?

    (1) the northward shift of the global temperature zones

    (2) the northward shift of the Sun’s vertical rays

    (3) a southward shift of the polar front jet stream

    (4) a southward shift of the subtropical jet stream

    2

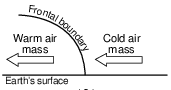
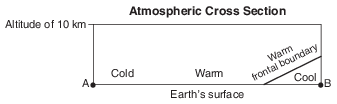
    A cross section of a weather front is shown below.

    meteorology, presentation-of-weather-data, meteorology, front, standard-6-interconnectedness, models fig: esci12012-examw_g7.png

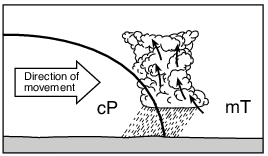
    Which symbol would be used to represent this front on a weather map?
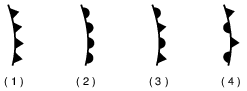
    meteorology, presentation-of-weather-data, meteorology, front, standard-6-interconnectedness, models fig: esci12012-examw_g6.png

    (1) 1

    (2) 2

    (3) 3

    (4) 4

    3

    The map below shows two seasonal positions of the polar front jet stream over North America.

    meteorology, transfer-of-heat-energy, seasons-and-astronomy, seasons, meteorology, front, meteorology, jet-streams, standard-6-interconnectedness, patterns-of-change fig: esci12012-examw_g13.png

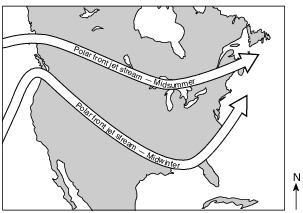
    Which statement best explains why the position of the polar front jet stream varies with the seasons?

    (1) Rising air compresses and cools in winter.

    (2) Water heats and cools more rapidly than land in winter.

    (3) Prevailing winds reverse direction in summer.

    (4) The vertical rays of the Sun shift north of the equator in summer.

    4

    The winds shift from southwest to northwest as heavy rains and hail begin to fall in Albany, New York. These changes are most likely caused by the arrival of

    (1) an mT air mass

    (2) a cT air mass

    (3) a cold front

    (4) a warm front

    Base your answers to questions 5 on the weather maps below and on your knowledge of Earth science. The weather maps show the eastern United States on two consecutive days. Some isobars are labeled in millibars (mb). Letter X represents a location on Earth’s surface on December 8, 2009.

    meteorology, presentation-of-weather-data, standard-1-math-and-science-inquery, velocity-slope-sediment-size-channel-shape-stream-valume-distance-from-the-sun-gravitational-force-period-of-revolution-speed-of-revolution, standard-1-math-and-science-inquery, changing-length-of-a-shadow-based-on-the-motion-of-the-sun, standard-6-interconnectedness, models fig: esci12016-examw_g36.png

    5

    Which type of front was located just south of New York City on December 9?

    (1) cold

    (2) warm

    (3) stationary

    (4) occluded

    6

    Which cross section correctly represents a cold front and the air-mass movements associated with this front?

    (1) meteorology, presentation-of-weather-data, meteorology, air-mass, meteorology, front, standard-6-interconnectedness, models fig: esci12018-examw_g10.png

    (2) meteorology, presentation-of-weather-data, meteorology, air-mass, meteorology, front, standard-6-interconnectedness, models fig: esci12018-examw_g11.png

    (3) meteorology, presentation-of-weather-data, meteorology, air-mass, meteorology, front, standard-6-interconnectedness, models fig: esci12018-examw_g12.png

    (4) meteorology, presentation-of-weather-data, meteorology, air-mass, meteorology, front, standard-6-interconnectedness, models fig: esci12018-examw_g13.png

    7

    The diagram below shows the locations of the two major jet streams in Earth’s atmosphere.

    meteorology, transfer-of-heat-energy, meteorology, weather-basics-and-observable-patterns, meteorology, front, meteorology, jet-streams, standard-1-math-and-science-inquery, changing-length-of-a-shadow-based-on-the-motion-of-the-sun, standard-6-interconnectedness, models fig: esci12020-examw_g9.png

    Compared to the subtropical jet stream, the polar front jet stream is at a

    (1) lower latitude and lower altitude

    (2) lower latitude and higher altitude

    (3) higher latitude and lower altitude

    (4) higher latitude and higher altitude

    Base your answers to questions 8 on the cross section below and on your knowledge of Earth science. The arrows on the cross section represent the air movement along a weather front between two different air masses. The air masses are labeled.

    meteorology, presentation-of-weather-data, meteorology, front, standard-6-interconnectedness, models fig: esci12020-examw_g30.png

    8

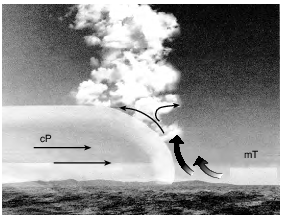
    Which type of front is represented by this cross section?

    (1) warm

    (2) cold

    (3) stationary

    (4) occluded

    9

    The map below shows a typical position and average velocity of the polar front jet stream during two different seasons.

    meteorology, transfer-of-heat-energy, seasons-and-astronomy, seasons, meteorology, weather-basics-and-observable-patterns, meteorology, front, meteorology, jet-streams fig: esci62012-exam_w_g3.png

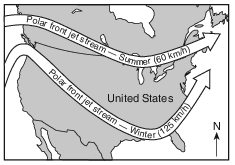
    For the eastern United States, the change of the polar front jet stream from this summer position to this winter position causes

    (1) warmer temperatures farther north and causes storms to move more slowly

    (2) warmer temperatures farther north and causes storms to move more rapidly

    (3) cooler temperatures farther south and causes storms to move more slowly

    (4) cooler temperatures farther south and causes storms to move more rapidly

    Base your answers to questions 10 on the weather map below, which represents a low-pressure system over New York State. The L on the map represents the center of the low-pressure system. Two fronts extend from the center of the low, and are labeled front 1 and front 2. Cloud cover has been omitted from the station models.

    meteorology, presentation-of-weather-data, meteorology, weather-variables, standard-6-interconnectedness, models fig: esci62012-exam_w_g14.png

    10

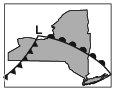
    Which map best represents the type of fronts and direction of movement of these fronts in relation to the low-pressure center?

    (1) reference-tables, key-to-weather-map-symbols, meteorology, presentation-of-weather-data, meteorology, front, standard-6-interconnectedness, models fig: esci62012-exam_w_g6.png

    (2) reference-tables, key-to-weather-map-symbols, meteorology, presentation-of-weather-data, meteorology, front, standard-6-interconnectedness, models fig: esci62012-exam_w_g7.png

    (3) reference-tables, key-to-weather-map-symbols, meteorology, presentation-of-weather-data, meteorology, front, standard-6-interconnectedness, models fig: esci62012-exam_w_g8.png

    (4) reference-tables, key-to-weather-map-symbols, meteorology, presentation-of-weather-data, meteorology, front, standard-6-interconnectedness, models fig: esci62012-exam_w_g9.png

    Base your answers to questions 11 on the weather map below and on your knowledge of Earth science. On the weather map, the location of the center of a high-pressure system (H) and a front are shown. Isobar values are labeled in millibars (mb). Weather station models represent the weather conditions at Atlanta, Georgia, and Tampa, Florida.

    reference-tables, key-to-weather-map-symbols, meteorology, presentation-of-weather-data, standard-1-math-and-science-inquery, changing-length-of-a-shadow-based-on-the-motion-of-the-sun, standard-6-interconnectedness, models fig: esci12018-examw_g53.png

    11

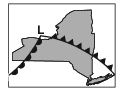
    Identify the type of front shown on the map. [1]

    front

    Allow 1 credit for stationary front.

    Base your answers to questions 12 on the weather map below and on your knowledge of Earth science. The map indicates the location of a low-pressure system over New York State during late summer. Isobar values are recorded in millibars. Shading indicates regions receiving precipitation. The air masses are labeled mT and cP. The locations of some New York State cities are shown. Points A and B represent other locations on Earth’s surface.

    reference-tables, key-to-weather-map-symbols, meteorology, transfer-of-heat-energy, meteorology, air-mass, standard-1-math-and-science-inquery, geocentric-model-heliocentric-model, standard-1-math-and-science-inquery, changing-length-of-a-shadow-based-on-the-motion-of-the-sun, standard-6-interconnectedness, systems-thinking fig: esci62015-exam_g36.png

    12

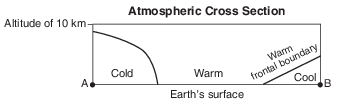
    The cross section in the image provided represents the atmosphere along the dashed line from A to B on the map. The warm frontal boundary is already shown on the cross section. Draw a curved line to represent the shape and location of the cold frontal boundary. [1]

    meteorology, presentation-of-weather-data, meteorology, front, standard-1-math-and-science-inquery, geocentric-model-heliocentric-model, standard-1-math-and-science-inquery, changing-length-of-a-shadow-based-on-the-motion-of-the-sun, standard-6-interconnectedness, models fig: esci62015-ansbk_abkq1.png

    Allow 1 credit for a line that starts from line AB, passes between the cold and warm labels, and curves up to the left.

    • Example of a 1-credit response:

    meteorology, presentation-of-weather-data, meteorology, front, standard-1-math-and-science-inquery, geocentric-model-heliocentric-model, standard-1-math-and-science-inquery, changing-length-of-a-shadow-based-on-the-motion-of-the-sun, standard-6-interconnectedness, models fig: esci62015-rg_g1.png

    Base your answers to questions 13 on the weather map below and on your knowledge of Earth science. The map shows the location of a low-pressure system over New York State during summer. Isobar values are recorded in millibars. The darker shading indicates areas of precipitation. Some New York State locations are indicated.

    meteorology, effect-of-vertical-atmospheric-movement, meteorology, air-mass, meteorology, front, meteorology, dewpoint-humidty-cloud-formation, standard-6-interconnectedness, patterns-of-change fig: esci62019-examw_g37.png

    13

    Describe the change in air pressure that will most likely occur at Rochester by the time that the cold front has reached Syracuse. Then describe what will most likely happen to the amount of cloud cover in Rochester with this change in air pressure and location of the cold front. [1]

    Change in air pressure: Amount of cloud cover:

    Allow 1 credit if both responses are correct. Acceptable responses include, but are not limited to:

    • Change in air pressure:

    • — slight decrease, then a steady increase

    • — generally increasing/rising

    • — lower to higher

    • — greater

    • Amount of cloud cover:

    • — It decreased.

    • — lower percent

    • — clear/0%

    • — There are fewer clouds.

    • — little cloud cover

    Base your answers to questions 14 on the weather map in image provided, on the data table below, and on your knowledge of Earth science. The map shows the center of a low-pressure system (L). Lines XY and XZ represent two fronts associated with this low-pressure system. Points R, S, and T represent locations on Earth’s surface. The data table lists weather conditions at these three locations.

    reference-tables, key-to-weather-map-symbols, meteorology, presentation-of-weather-data, meteorology, front, standard-1-math-and-science-inquery, changing-length-of-a-shadow-based-on-the-motion-of-the-sun, standard-6-interconnectedness, models fig: esci62022-exam_g47.png

    14

    On the weather map in the image provided, draw weather-front symbols on the correct sides of both line XY and line XZ to show the most probable type and direction of each moving front. [1]

    reference-tables, key-to-weather-map-symbols, meteorology, presentation-of-weather-data, meteorology, front, standard-1-math-and-science-inquery, changing-length-of-a-shadow-based-on-the-motion-of-the-sun, standard-6-interconnectedness, models fig: esci62022-answerbooklet_abkq6.png

    Allow 1 credit for the placement of the correct symbols facing in the correct directions for both fronts.

    reference-tables, key-to-weather-map-symbols, meteorology, presentation-of-weather-data, meteorology, front, standard-1-math-and-science-inquery, changing-length-of-a-shadow-based-on-the-motion-of-the-sun, standard-6-interconnectedness, models fig: esci62022-rg_g5.png

    Base your answers to questions 15 on the map in image provided, which shows surface air temperatures, in degrees Fahrenheit, for a portion of the United States. These temperatures were recorded at noontime on the same winter day. Two coastal cities are labeled: Atlantic City, New Jersey, and Miami, Florida. Other selected locations are labeled A, B, and C.
    15

    A frontal boundary exists between locations B and C. Identify one process that causes clouds to form in the moist air rising along this frontal boundary. [1]

    Allow 1 credit. Acceptable responses include, but are not limited to:

    • — expansion

    • — cooling to the dewpoint

    • — condensation

    • — cooling

    • — deposition